


Business Intelligence for Finance Teams: Use Cases, Benefits, and Key Tools

October 3, 2026
- The foundation is everything: BI fails when it connects to unvalidated reporting databases instead of the core ledger and PSP settlement feeds.
- Metrics must be modeled: A central semantic layer ensures "revenue" means the same thing across every dashboard.
- Custom vs. Off-the-shelf: Tools like Power BI and Looker handle standard reporting, but complex multi-entity reconciliation or high-frequency trading data often demand custom BI architectures.
- Automation impact: Connected BI cuts month-end close cycle times by up to 50%.
Most fintechs have data. What they lack is a reliable way to act on it.
Ledger entries sit in one system. PSP transaction logs live in another. ERP data is exported weekly. And the CFO is still waiting for a number that reflects what happened yesterday. This is the real problem business intelligence for finance is meant to solve: not dashboards, but a trustworthy, unified view of financial performance that finance teams can act on in time to matter.
This guide is written for CFOs, finance directors, and data leads at fintechs and financial services firms. If you’re weighing whether to connect your existing stack to a BI platform or build something purpose-built, the decision tree matters more than the tool list.
What Financial BI for Finance Actually Means
Financial business intelligence is the practice of connecting raw financial data sources, ledgers, payment processors, ERPs, and core banking platforms and transforming that data into reports, dashboards, and forecasts that support operational and strategic decisions.
The definition sounds straightforward. The execution is not. Most finance teams spend up to 75% of their time gathering and reconciling data.
The gap between owning a BI tool and owning trustworthy numbers defines whether business intelligence in finance creates real value or just creates more dashboards nobody trusts.
A practical working definition: BI for finance is the full stack (data connectors, transformation pipelines, a governed data model, and a presentation layer) that lets finance teams move from “I need to pull a report” to “I already have the answer.”
Why Finance Teams Can’t Skip the Data Foundation
Before discussing tools or use cases, the data architecture question has to come first. This is where most BI implementations fail.
Finance data isn’t like marketing or product data. It has three specific requirements:
- Legal and audit requirements. Every figure must trace back to a source with a clear lineage.
- Reconciliation constraints. Numbers in the BI dashboard must match the ledger, the PSP settlement report, and the regulatory filing, always.
- Multi-source complexity. A single P&L figure for a fintech may pull from a core banking ledger, a card processing feed, an FX settlement table, and a manual accruals spreadsheet.
Teams building regulated products through DashDevs’ banking software development services design the data layer before the BI layer. Retrofitting audit-grade lineage after the fact is significantly harder.
According to the Cambridge Centre for Alternative Finance 2026 Global AI in Financial Services Report, data availability and quality are the top barriers to analytics adoption, cited by 49% of traditional financial institutions.
The implication for BI builds: the data layer isn’t a prerequisite you handle after the tool decision. It is the decision. A BI platform running on fragmented, unvalidated data produces fast answers to the wrong questions.
The Three Data Sources That Decide BI Reliability
These are the integrations that determine whether BI produces numbers you can take to a board meeting.
1. The ledger
This is the source of truth for all balance and transaction data. If your BI system reads from a reporting database rather than the validated, double-entry ledger, reconciliation will drift. Our guide to what a ledger is in banking and fintech is the starting point. DashDevs’ financial data integration partner practice treats ledger connectivity as the first integration.
2. The payment processor or PSP
Settlement timing, fee netting, chargeback reserves, and FX spreads: these live in the PSP layer and are often missing from ERP exports. Any financial reconciliation workflow that skips the PSP feed produces a net revenue figure that is typically off by 3% to 8% due to uncaptured processing fees, FX spreads, and reserve holds.
3. The ERP, or core banking system
While the core banking platform manages customer accounts and deposit ledgers, the ERP tracks corporate general ledgers, cost centers, and inter-entity eliminations. Connecting both correctly means mapping how operational transactions align with financial journal entries.
Getting all three into a single governed data model is financial data aggregation work. The BI platform sits on top of it. A multi-account ledger is what keeps those feeds from drifting apart as products multiply.
The Data Architecture Behind Trustworthy BI
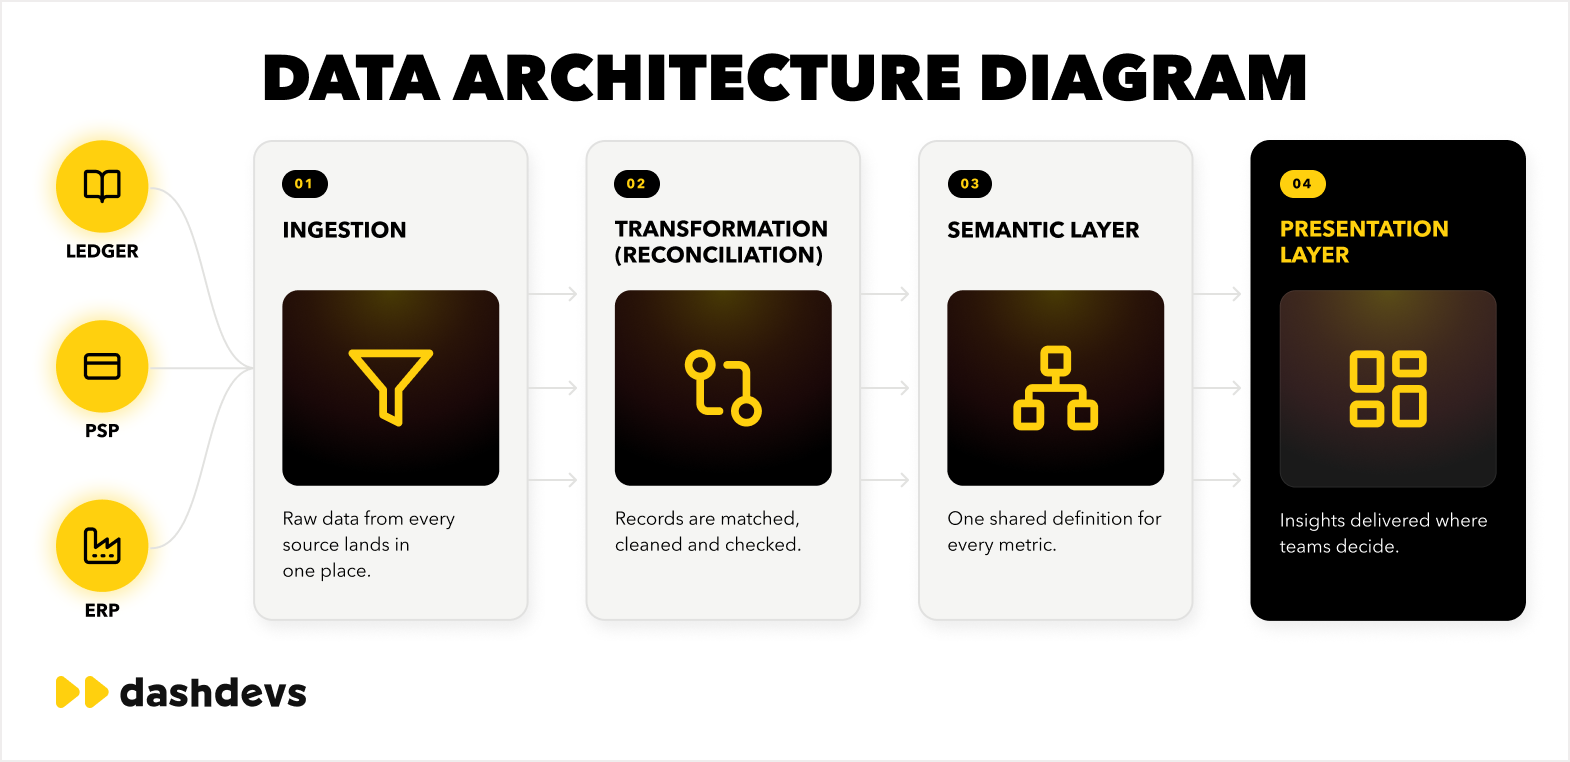
The difference between a BI implementation that finance trusts and one they work around comes down to how the data pipeline is built.
A production-grade BI architecture for finance has four layers:
- Ingestion layer. Raw data from ledger, PSP, ERP, and other sources is extracted and loaded without transformation. This preserves source fidelity and supports audit trails.
- Transformation layer. Data is cleaned, validated, and modeled. This is where reconciliation logic lives: validating that ledger balances match PSP settlements, that FX conversions apply the right rates, and that inter-entity eliminations are correct.
- Semantic layer. Metrics are defined once: what “revenue” means, how “active customer” is counted, and what “cost per transaction” includes. This layer prevents metric drift across dashboards. It is the most underinvested layer in most BI implementations.
- Presentation layer. This is the dashboard or report surface. It is the only layer most people see and the only layer that gets blamed when the numbers are wrong.
Teams that invest in layers 1 through 3 have BI that finance teams actually trust. Teams that skip to layer 4 have dashboards that produce fast answers to questions nobody can verify.
Pro tip: After 17+ years integrating ledgers, PSPs, and ERPs, I won’t sign off on a dashboard until the semantic layer names every metric and the transformation layer can prove it against last month’s closed books.
Data science in fintech extends this architecture further, adding predictive models, anomaly detection, and sentiment analysis in financial forecasting on top of a reliable data foundation.
5 High-Impact Business Intelligence Use Cases for Finance Teams
Finance business intelligence and business intelligence in banking share the same core use cases. The role of BI in finance varies by team size and complexity. These five are where the measurable business impact is highest.
1. Automated Financial Reporting
The Problem: 50% of finance teams still take more than five business days to execute month-end close, and 94% still rely on manual Excel extraction somewhere in the process.
The BI Solution: Connecting BI directly to source systems eliminates manual data extraction and reformatting. Teams that automate the reporting layer typically cut close cycle times by 30% to 50%, in line with FloQast’s Forrester TEI findings on enterprise close cycles.
Required Data Sources: Ledger, ERP, PSP settlement files, and multi-entity consolidation tables.
Key KPIs Moved: Close cycle time, reporting errors per period, and hours per finance FTE spent on data preparation.
We’re seeing a clear shift toward integrated, data-driven decision-making where technologies, including AI, help finance teams measure performance across the enterprise.
2. Real-Time P&L and Revenue Tracking
The Problem: For fintechs operating at high transaction volumes, a P&L report delivered on a weekly batch cycle is a lagging indicator. By the time the report lands, the margin bleed is already two weeks old.
The BI Solution: Real-time data processing connected to BI changes the time horizon. A live P&L dashboard reading from the ledger and PSP feed gives the CFO a view of net revenue, fee expense, and contribution margin by product line, updated as transactions settle.
Required Data Sources: Ledger (real-time API), PSP transaction feed, live FX rate feeds, and cost center data from the ERP.
Key KPIs Moved: Time-to-insight on margin changes, revenue per product line, and cost-per-transaction visibility.
3. Cash Flow Forecasting and Scenario Planning
The Problem: Scenario planning traditionally takes a week of analyst time in disconnected spreadsheets, making agile responses to market shifts impossible.
The BI Solution: Protiviti’s 2026 Global Finance Trends Survey found that AI use for financial forecasting rose to 76% of finance organizations. Connected BI platforms pull actuals from the ledger and ERP, apply statistical models, and run scenario analysis in minutes rather than days.
Required Data Sources: Historical ledger data, ERP budget data, external interest/FX rate data, and headcount/cost data.
Key KPIs Moved: Forecast variance, days required to generate scenario models, and cash runway visibility.
4. Risk and Fraud Monitoring Dashboards
The Problem: Fintech risk management requires simultaneous visibility across transaction patterns, counterparty exposure, and regulatory limits. Disconnected systems leave blind spots.
The BI Solution: This is a continuous monitoring function. A BI layer connected to transaction data, AML flags, and exposure tables provides risk teams with a single, live operational view.
Required Data Sources: Transaction ledger, AML scoring engine output, counterparty tables, and limit management systems.
Key KPIs Moved: Time-to-flag on anomalous transactions, false-positive rates on AML alerts, and regulatory exposure vs. set limits.
5. Unit Economics and Product Profitability Analysis
The Problem: Calculating true product profitability is impossible when revenue lives in the ledger, processing costs live in the PSP, and customer acquisition costs live in the CRM.
The BI Solution: BI unifies these sources to track exact unit economics: revenue per customer, cost to serve, contribution margin by product, and LTV vs. CAC.
Required Data Sources: Ledger (for revenue attribution), PSP (to net out payment costs), CRM/product database (for customer-level data), and cost allocation tables.
Key KPIs Moved: Contribution margin by SKU/product, CAC payback period, and gross margin per cohort.
DashDevs built the BI and data automation team for Thrasio, enabling the team to track unit economics and contribution margin across hundreds of product SKUs with automated data pipelines. This replaced manual reporting that previously ran days behind actuals.
BI Tools for Finance Teams: A Practical Comparison
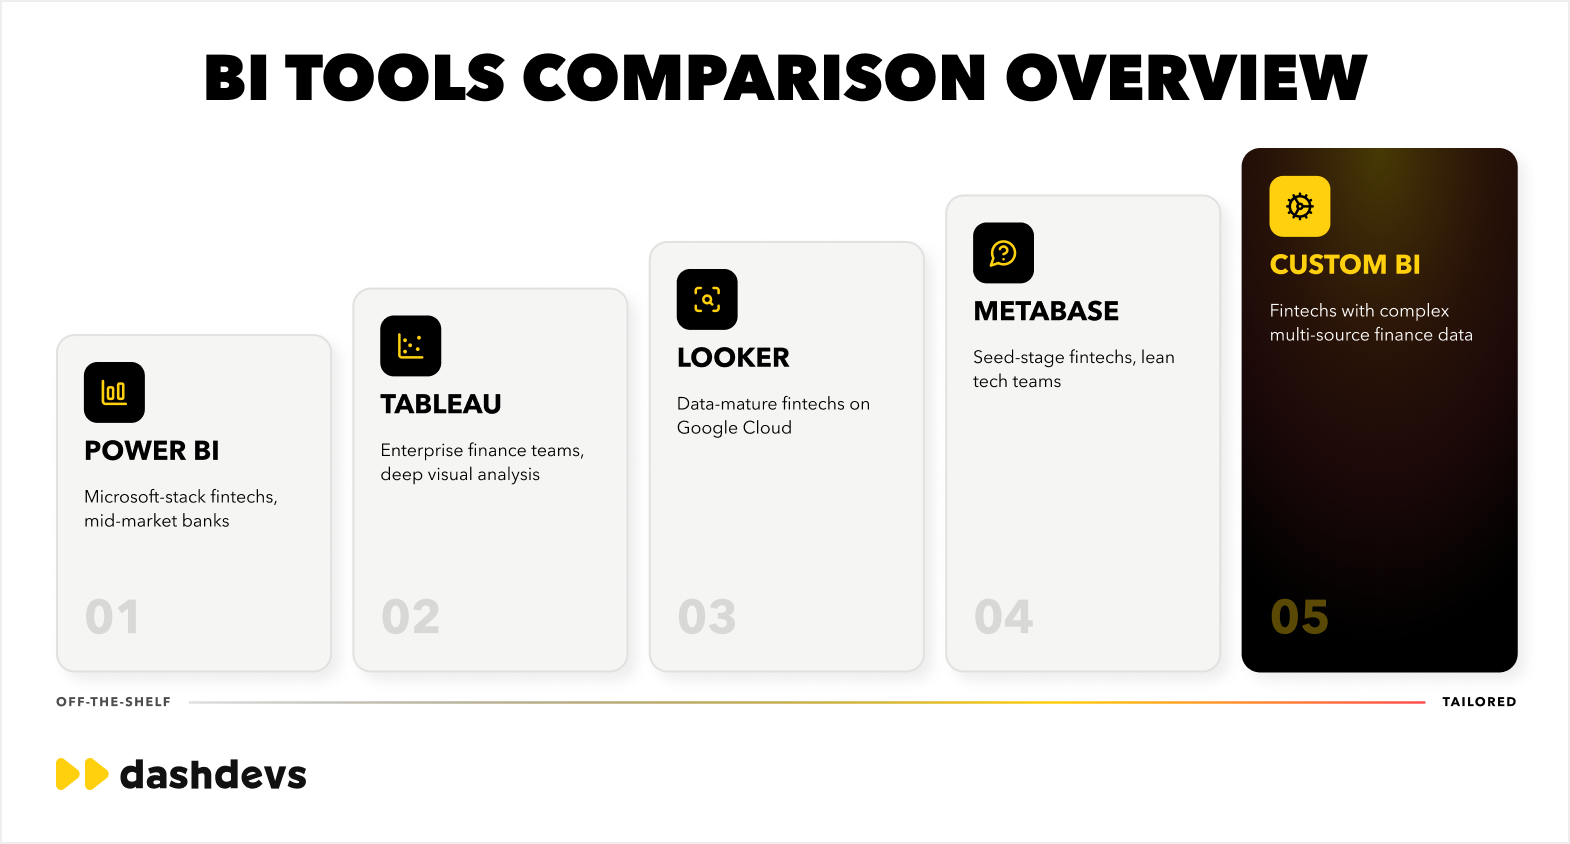
The fintech data analytics tool market in 2026 breaks into three tiers. The right choice depends on your data architecture, team size, and how much customization your reporting model requires. Our fintech data analytics piece covers what sits beyond dashboards.
Here is how the leading platforms compare on criteria that matter specifically for financial use cases:
| Tool | Best fit for finance | Finance-specific strengths | Key limitation |
|---|---|---|---|
| Power BI | Microsoft-stack fintechs, mid-market banks | 150+ native connectors (SAP, Dynamics, NetSuite, QuickBooks); DAX engine for complex financial calculations; row-level security | Governance at scale requires premium licensing; AI Copilot requires M365 E3+ |
| Tableau | Enterprise finance teams, deep visual analysis | Best-in-class visualization; certified data source governance; Tableau Pulse for AI summaries | Enterprise pricing tier (typically around $75/user/mo for Creators) |
| Looker | Data-mature fintechs on Google Cloud | Semantic layer (LookML) ensures one metric definition across all reports — a critical requirement for financial consistency | High entry barrier (typically requires ~$50k/year minimum commitment) |
| Metabase | Seed-stage fintechs, lean tech teams | Free self-hosted tier; fast to first dashboard; SQL-native for technical users | No semantic layer; performance degrades on large datasets; limited governance |
| Custom BI | Fintechs with complex multi-source finance data | Full control over data model, ledger integration, reconciliation logic, and audit trail | Requires engineering investment and an internal data team |
The hardest BI rule in finance: A shared metric definition is the prerequisite for any BI dashboard to be trusted. If “revenue” means something different in the P&L dashboard vs. the sales pipeline report, the tool doesn’t matter. The data model is broken.
Looker’s LookML semantic layer solves this architecturally. Power BI solves it operationally with certified datasets and workspace governance. Metabase and most off-the-shelf tools leave this problem to the team to manage manually.
Build vs. Buy: The Decision Finance Teams Actually Face
The financial business intelligence software decision is rarely “which tool.” It is “how much do we build on top of the tool?”
Every off-the-shelf BI platform requires configuration. The question is whether that configuration work is within the platform’s native capabilities or whether it requires custom engineering.
Off-the-shelf BI fits when:
- Your data sources have native connectors in the platform (ERP, CRM, PSP)
- Your reporting model is standard (P&L, cash flow, variance analysis)
- Your team has the bandwidth to own the data model inside the tool
- Governance requirements are met by the platform’s built-in access controls
Custom or hybrid BI fits when:
- You need a reconciliation layer that validates BI figures against ledger balances before surfacing them
- Your reporting model requires complex attribution logic (multi-entity, multi-currency, product-level cost allocation)
- You have real-time requirements that off-the-shelf platforms don’t support at your data volume
- Regulatory reporting requires an auditable, traceable data lineage that the BI platform alone can’t provide
DashDevs’ business intelligence development services cover both paths: implementation on existing platforms and custom BI architecture for fintechs where the data complexity exceeds off-the-shelf capability. For a full framework, see our guide on deciding whether to build, buy, or partner on fintech infrastructure.
Common BI Implementation Mistakes in Finance
These are the failure patterns that appear most often when finance teams start a BI project without a clear data architecture plan.
Connecting to reporting databases instead of source systems. Many ERPs and core banking platforms have read-optimized reporting schemas separate from the transactional tables. These schemas are often days behind. Connecting BI to them produces dashboards that look current but lag actuals.
Skipping reconciliation logic. Off-the-shelf BI platforms don’t validate that the data they display matches the ledger. Without a reconciliation step in the transformation layer, finance has no way to know when BI figures diverge from the books.
Building dashboards before defining metrics. Metric definitions belong in the data model, not the dashboard configuration. Teams that define “revenue” at the dashboard level end up with three dashboards showing three different revenue figures.
Treating RPA in finance as a BI substitute. RPA automates extraction and movement of data. BI analyzes it. Finance teams that use RPA bots to pull data into spreadsheets and then build charts on those spreadsheets have built a fragile data pipeline.
Underestimating scale requirements from the start. Most fintechs scope BI to current reporting needs. The data volume and use case expansion that comes with growth (product analytics, risk modeling, and regulatory reporting) require an architecture designed for scale from day one.
Our Tower ERP project is a concrete example. We automated P&L reporting in a complex ERP environment, which required rebuilding the transformation and semantic layers before a single dashboard was built.
According to Gartner’s 2025 AI in Finance Survey, while overall adoption growth is proceeding more slowly, 67% of finance teams using AI report greater optimism than last year.
Step-by-Step: How to Implement Financial BI You Can Trust
- Audit your current data sources. List every system that holds financial data: ledger, PSP, ERP, banking API, and spreadsheets. For each, identify whether a native connector exists, how frequently data refreshes, and who owns data quality.
- Define your critical metrics first. Before picking a tool, write down the 10 to 15 metrics that matter most to your CFO. For each: what is the exact definition, what data sources does it require, and who is accountable for its accuracy?
- Map the reconciliation requirements. Identify which metrics require validation against a source-of-record. Build that reconciliation step into the architecture.
- Choose the tool to fit the data model, not the other way around. A team with clean ERP data and a Microsoft stack can move fast with Power BI. A team with complex multi-source data and custom attribution logic needs either Looker or a custom build.
- Build the semantic layer before the dashboards. Define metrics in the data model. Get finance sign-off on definitions before a single dashboard is built.
- Run a reconciliation test before launch. Before putting a dashboard in front of finance, compare BI figures against a known-correct source for the most recent closed period. Document any discrepancies and trace them to their source.
Our investment platform with intelligent analytics followed this sequence: data architecture first, metric definitions second, and dashboards third. The result was a reporting layer that finance teams trusted from day one, without a reconciliation process running in parallel.
DashDevs’ custom fintech software applies the same sequencing: data foundation before the presentation layer.
The Bottom Line
Business intelligence for financial services is a solved problem architecturally. The case for business intelligence for finance has already been made. The platforms exist. The connectors exist. The gap is almost always in the data foundation: fragmented sources, absent reconciliation logic, and undefined metrics. Understanding the business benefits of big data early is what pushes teams to invest in that foundation correctly, rather than treating it as an infrastructure cost.
The teams that get BI right in finance treat it as a data engineering problem first and a visualization problem second. The dashboard is the output of a well-built data system.
Fintech data analytics (whether it runs on Power BI, Looker, or a custom stack) only works when the numbers it surfaces are the same numbers finance would trust in an audit. That is the standard worth building to.
Share article
